
We develop the algorithms, produce the added-value data, and deliver it straight into our clients' information systems. Fifteen years took us from automated SAR processing, through operational CAP monitoring for the paying agencies of Lithuania and Latvia, to a continental archive of analysis-ready radar data — now opening to multiple sensors, combined algorithms and client-specific data cubes.


Automated mass production of added-value datasets from Earth observation data, using free software and custom-designed hardware.
A parallel cluster built for one purpose — handling pan-European volumes of imagery without a data centre behind it.
Automated processing of Sentinel-1 polarimetry SAR data — a back-end system for all further developments and added-value services.
The land-monitoring platform takes shape with the first land use mapping algorithms developed for agricultural parcels.
A dedicated system for testing an Area Frame Sampling scheme, based on polarimetry SAR data, on declared farmland parcels within a designated CAP control time frame.
Per-field CAP control checks across millions of parcels, maintained and improved every season.
An archive of 1.2 million analysis-ready polarimetry SAR images across 50 countries, published on-line through open standards for integration with the Copernicus Data Space Ecosystem.
What comes next is already running: client-specific data cubes holding exactly the sensors a given problem needs, combined algorithms matched to it, and custom interfaces that deliver the result into the client's own systems rather than into a report.
Forty national map archives, each produced by the same chain, every growing season since 2015. Drag the strip or use the arrows; select any country to open its on-line map.
Six lines of work resting on one capability: turning raw radar acquisitions into measurements that hold up operationally, commercially and in dispute.
Raw Sentinel-1 GRD becomes calibrated, terrain-corrected backscatter time series, served through STAC and Open Data Cube standards — at continental scale, covering Europe and its neighbouring states.
γ⁰ VV · VH — 2015 onwardCustom algorithms, automated production and on-line delivery of large volumes of thematic mapping data — statistical sampling, analysis, and results pushed into client systems through OGC services and API endpoints.
OGC · REST · STACClient-specific cubes holding exactly the sensors and algorithms a problem needs, with a custom interface on top — delivered into the client's information system rather than handed over as files.
Multi-sensor · client-hostedAutomated workflows on entirely open-source stacks, designed to run unattended at volumes that would otherwise need a department.
FOSS since 2011Millions of declared fields assessed against the radar record across a full season, resolved inside ten-day windows, under contract to national paying agencies.
Lithuania · LatviaDated, defensible measurement of what actually happened on a field. Used for insurance claims, subsidy disputes and as expert evidence in court proceedings.
Insurance · legalAnnual, Europe-wide, and directly comparable year to year — because the same processing chain has produced every season since 2015.
40 national archivesEco- and geo-informatics advice, innovative project development, and downstream service partnerships across European programmes.
EU projects · downstreamThree operational systems. Two are open; the third runs under contract to national paying agencies.
Land cover status (farming intensity) and change (crop types) Sentinel-1 radar satellite maps for 45 countries, produced for every growing season since 2015: 980 layers in total.
Open the maps catalogueDirect access to the archive through a STAC API, Python and QGIS, with a free researcher tier. Developed under the ESA GSTP programme.
Explore the data cubeAssesses millions of declared fields against the Sentinel-1 record for the national paying agencies of Lithuania and Latvia — threshold control and crop prediction on per-field time series.
About the serviceRadar does not take a photograph. It measures how a surface scatters energy back — through cloud, at night, on the same schedule regardless of weather. Because that measurement has been made the same way since 2015, the same ground can be placed side by side across years and the difference means something. Everything below is at full product resolution: single fields, not regions.
Kherson oblast · 46.6°N 33.4°E · ~25 km across · crop map, spring
Irrigated arable land on the left bank of the Dnipro, with the centre-pivot circles and the surrounding field mosaic individually resolved.


Before the occupation in 2022, southern Ukraine had developed formidable agricultural production capacity — visible on the left as a mosaic of different crops and farming practices. After four years of occupation the same fields stand abandoned and overgrown with weeds, with only a few visible attempts to maintain active farming.
Beauce, France · 48.28°N 1.70°E · ~10 km across · crop map, spring
The field boundaries hold still; the colours do not.
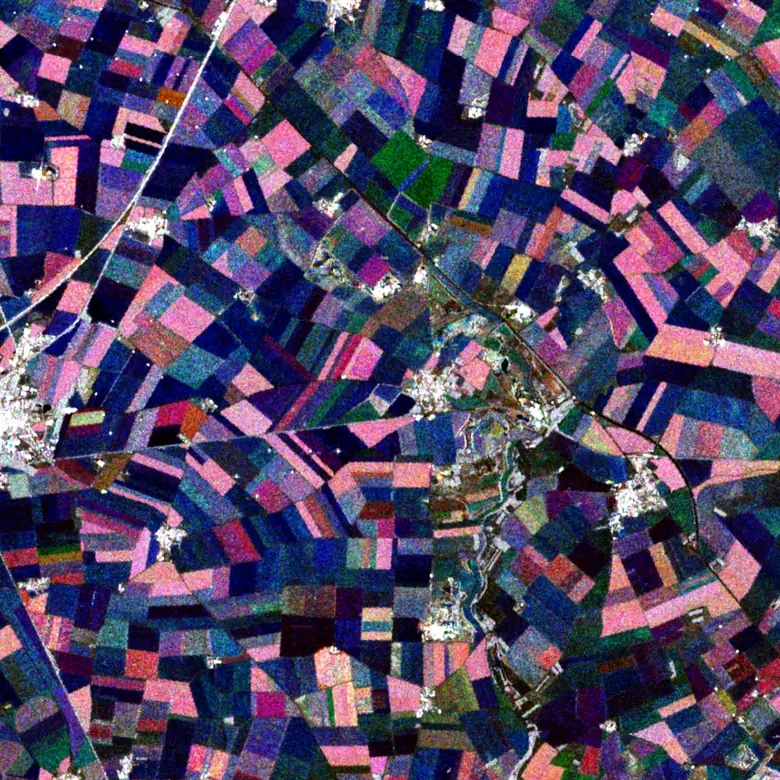
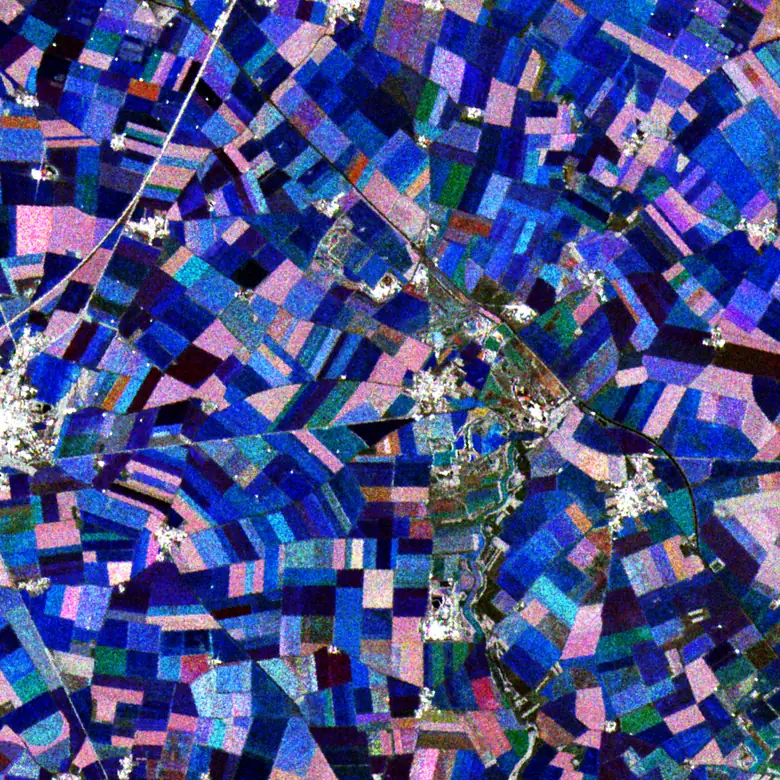
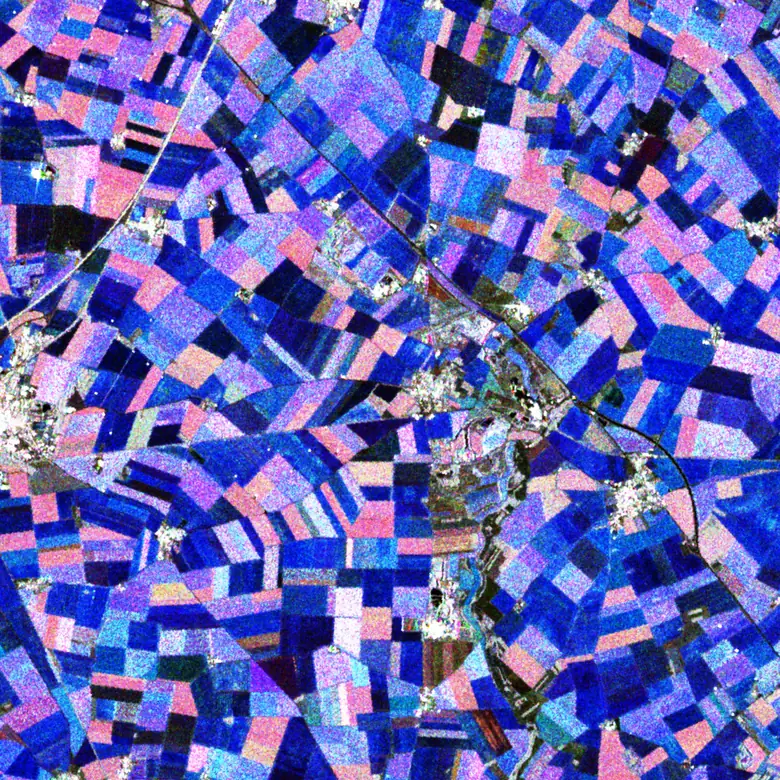
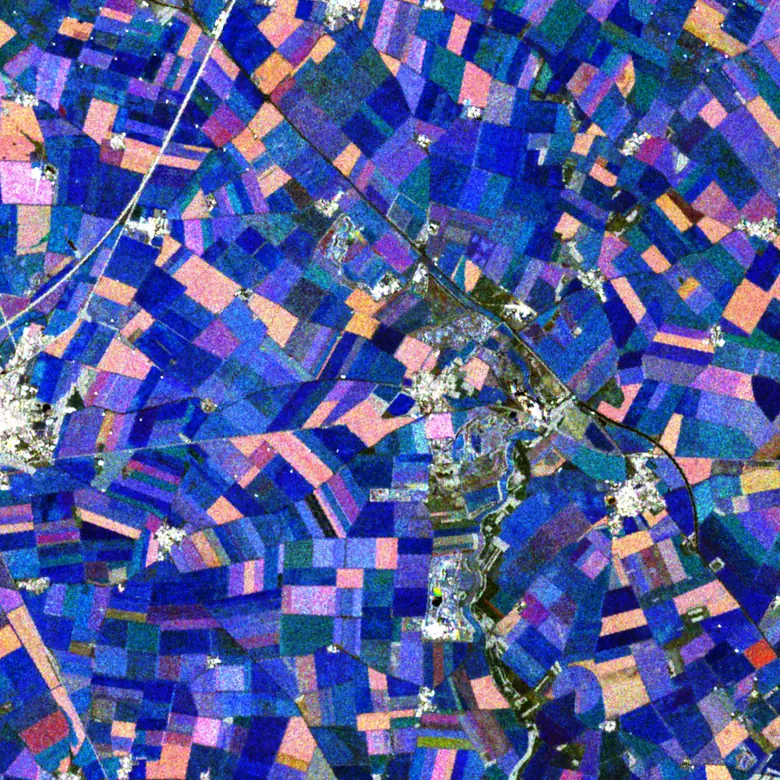
Different crop types appear in different colours on three-month dynamic SAR maps, because they differ in growth intensity, in morphology, and even in the farming practices each crop requires. Monitoring crop rotation means observing which crop type is grown in the same field in consecutive years. Try it here: look for fields that repeat the same colour from one year to the next. In the CAPCON platform this is done automatically, for millions of fields.
Zealand, Denmark · 55.44°N 11.91°E · ~19 km across · spring 2025
The two map families answer different questions from the same radar record.


Dense time series of polarimetric SAR data allow two tiers of land use and land cover mapping, both open to visual interpretation.
Dynamic crop maps (right) represent how fast the SAR signal changes per pixel over a given period — usually the peak of the crop development season. The colours show when surface reflection was strongest: blue in the earliest part of the period, red in the latest, green in the middle, and light grey where the signal held maximum strength throughout. From this we know that blue fields carry cereals, orange rapeseed, magenta maize, potatoes or legumes, and dark green meadows.
The second tier rests on the statistical distribution of reflected signal intensity. These land use intensity maps (left) show how long a field stood ploughed, or how many times it was ploughed during the season. Ash-grey marks unploughed grassland, light grey the woody vegetation of gardens, shrubs and forest, khaki the winter crops, and the brightly shining colours the spring crops.
Every significant engagement since the company was founded. Detail on any of them is available under NDA.
Our first client: PASSAM AG, a Swiss company running an advanced laboratory for environmental analysis and air pollution measurement, and still operating today. We handled the geo-processing and mapping of their sampling results across Lithuanian cities.
Lot 6, funded by the European Environment Agency and sub-contracted under INDRA Espacio. Three people delivered two of the five pan-European thematic layers — inland Water and Wetlands — at 10 m resolution across 6.5 million km², from IRS-P6 and SPOT imagery. The other lots were produced by consortia of several companies each; of the five layers, one was never successfully delivered by anyone.
A pilot under direct contract with the National Paying Agency of Lithuania, testing whether a national CAP monitoring service could be built on Copernicus data. It led to CAPCON and to the operational service that followed.
Copernicus imagery and analysis assessing crop damage caused by wild animals and severe weather. Small in volume, but the first cases in Europe in which analysis-ready Sentinel-1 SAR data was accepted as evidence by a civil court.
The operational service began in Lithuania in 2020 under commercial contract, as the ESA PECS CAPCON project was closing, and is contracted through to 2028. UAB iTree, which maintains the paying agency's information system, is prime contractor; Geomatrix is sub-contractor for CAP Area Frame Sampling services built on Copernicus data. Across that cooperation we have developed every downstream CAP and Farmer Advisory Service in Lithuania and produce the majority of the added-value thematic data powering them. Since 2023 the same services run for the National Paying Agency of Latvia.
Six contracts to date across four ESA programmes — PECS, RPI, FutureEO and GSTP.
CAP control using an Area Frame Sampling scheme.
CompletedSmart farming services from Earth observation data.
CompletedAgricultural damage and risk assessment.
OngoingSustainable management of permanent grassland.
OngoingGreen Transition Information Factories demonstration for the Baltic Sea Region.
CompletedOpen Data Cube for analysis-ready SAR data.
Phase 1 complete · Phase 2 from 2026Three European Commission programmes, spanning research, business development and cross-cluster collaboration.
Landslide modelling and tools for vulnerability assessment, preparedness and recovery management.
CompletedSentinels-based Agriculture Information Service Component — where the SAGRIS concept and its first business development plan were written.
CompletedPromoting the international competitiveness of European remote sensing companies through cross-cluster collaboration.
CompletedFour ways into the same archive, depending on what you came for.
CAP Area Frame Sampling delivered under commercial contract since 2020 — running today for Lithuania and Latvia, contracted through to 2028.
The CAPCON service1.2 million analysis-ready scenes over 50 countries, a free researcher tier, and six ESA contracts behind the platform.
SAGRIS Open Data CubeField-level damage and risk assessment — including the first Sentinel-1 evidence accepted by a civil court in Europe.
See it at field resolutionFifteen years of unbroken European coverage, now opening to multiple sensors, combined algorithms and client-specific data cubes.
Start a conversationGeomatrix UAB has a team of less than 10 people, yet they have built and now operate one of Europe's largest archives of analysis-ready Sentinel-1 SAR data — 1.2 million processed scenes across 50 countries in Europe and the Middle East — on a parallel cluster designed, deployed and operated inside the company, using nothing but free and open-source software.
That combination is unusual, and it is deliberate. Since 2011 the company has held one position: automated mass production of analysis-ready SAR data and added-value downstream products from Copernicus satellite images. Innovation, automation and efficiency — aimed at production, downstream services and algorithms, holding that position season after season.
The work is research-grade, and the track record shows it: nine funded projects across six European programmes — FP7, H2020, ESA PECS, RPI, FutureEO and GSTP — several of them still running, alongside commercial service contracts that have not been interrupted since 2020. Of the six people currently working in the company, two hold doctorates and four hold master's degrees. Each of them has been here at least five years.
Commercial products, data access, evaluation licences and project partnerships all start the same way.
+370 699 99940 · Mokslininkų 2A, 08412 Vilnius, Lithuania